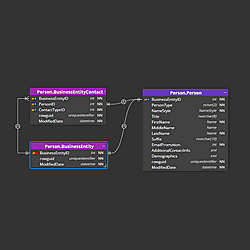
In the world of database design, clarity and structure are paramount. This is where Entity-Relationship (ER) diagrams come into play. ER diagrams simplify the complexities of relational databases, making it easier for developers, analysts, and stakeholders to understand, design, and communicate database structures. In this blog post, we’ll explore the significance of ER diagrams.
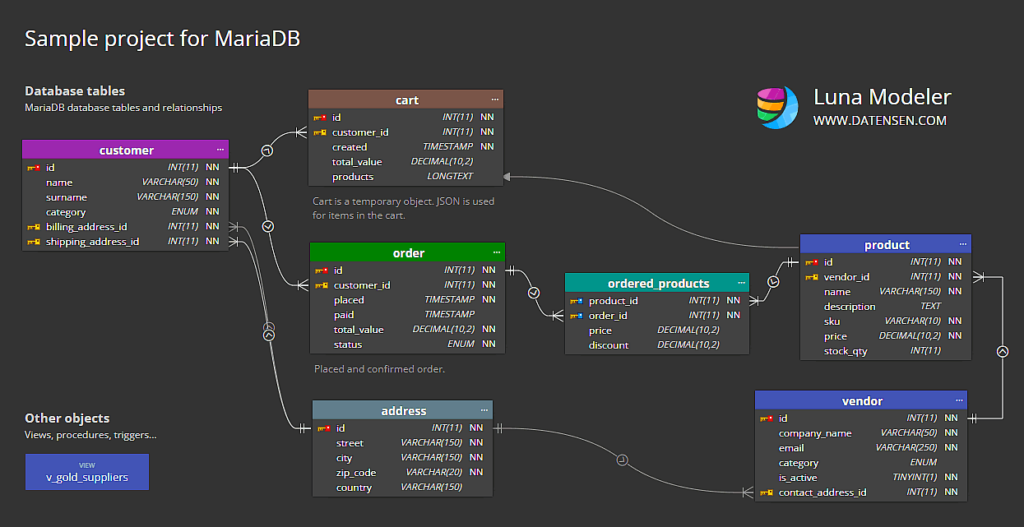
Benefits of using ER diagrams
- Visualization: ER diagrams provide a clear visual representation of the database structure
- Communication: They serve as a common language between developers, analysts, and stakeholders, facilitating better communication and collaboration.
- Design: ER diagrams help in designing a well-structured database by identifying entities, attributes, and relationships early in the development process.
- Documentation: They offer thorough documentation of the database schema, which is invaluable for maintenance and future development.
Tools for Creating ER Diagrams
There are numerous tools on the market designed to produce ER diagrams, each offering unique features to cater to different needs and preferences. Among these, Luna Modeler stands out as a user-friendly desktop data modeling tool that simplifies the process of database design.
Luna Modeler not only allows users to create basic ERDs with ease but also offers advanced capabilities to enhance ER diagrams with sub-diagrams and additional elements. This flexibility enables users to create more detailed and comprehensive representations of their database structures.
Enhancing Communication with Sub-Diagrams and Additional Elements
Using sub-diagrams, textual information, arrows, images, and various view options can significantly enhance the communication of database design in ER diagrams.
Sub-diagrams in ERD
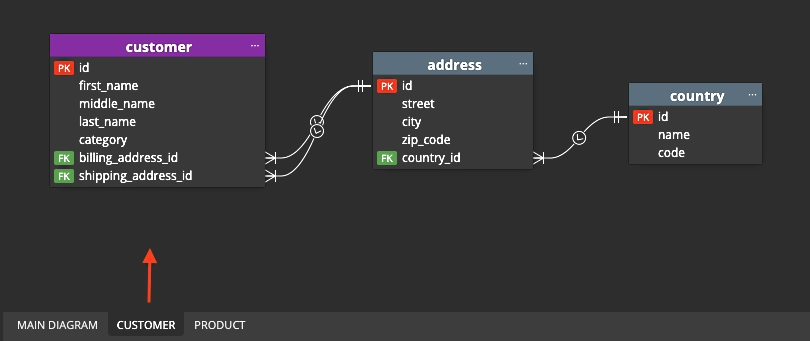
Sub-diagrams allow you to break down complex database structures into more manageable and focused segments. This makes it easier to concentrate on specific parts of the database without being overwhelmed by the entire schema. On the following screenshot you can see the Customer sub-diagrams and objects related to the customer database table.
Textual information, captions, descriptions and other elements
Adding textual information provides context and explanations that can clarify the purpose and function of various entities and relationships. Arrows and other visual indicators can effectively illustrate data flow and relationships, adding clarity to how different parts of the database interact.
Including images and alternative view options can offer different perspectives on the same data, catering to the diverse preferences and needs of stakeholders. These elements collectively make ER diagrams more informative, engaging, and easier to understand, ensuring that your database design is communicated effectively to all audiences.
Exporting ER Diagrams to PDF and Printing
Exporting ER diagrams to PDF is a practical way to share and print detailed database documentation. Most database design tools offer a straightforward option to export the ERD to a PDF file.
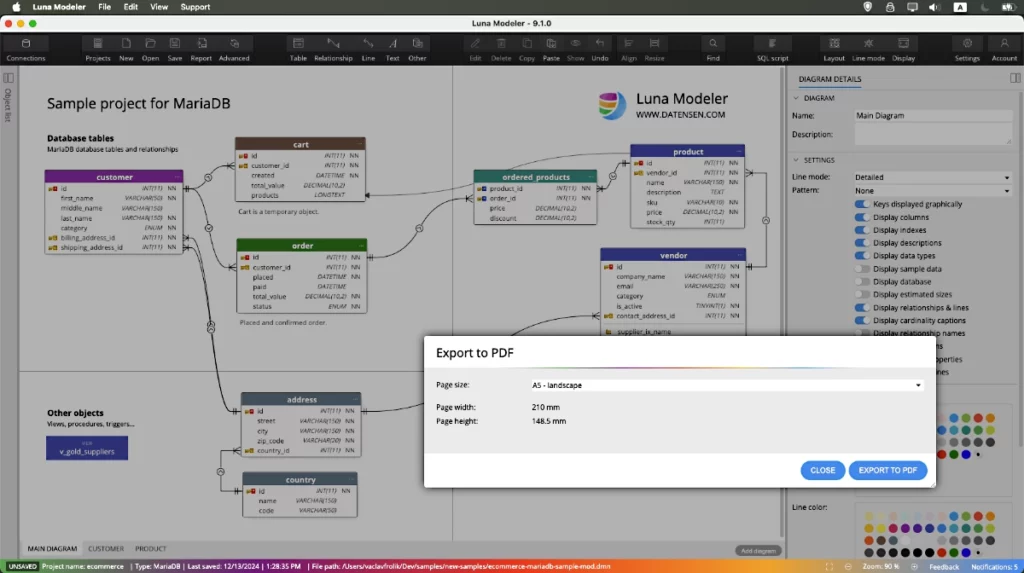
Once exported, the PDF can be printed to provide a tangible version of the diagram, which can be useful for team meetings, presentations, or keeping a hard copy for reference. Having a printed ERD allows team members to easily annotate and discuss changes or improvements during collaborative sessions.
Producing HTML Reports
HTML reports are another valuable way to document and share ER diagrams. These reports can include interactive elements, such as clickable links, making them more dynamic and user-friendly.
By generating HTML reports, you can create an accessible and organized documentation that can be easily hosted on an internal website or shared with stakeholders via email.
In Luna Modeler, you can generate reports in various styles.

Comparing Current and Modified Database Structures
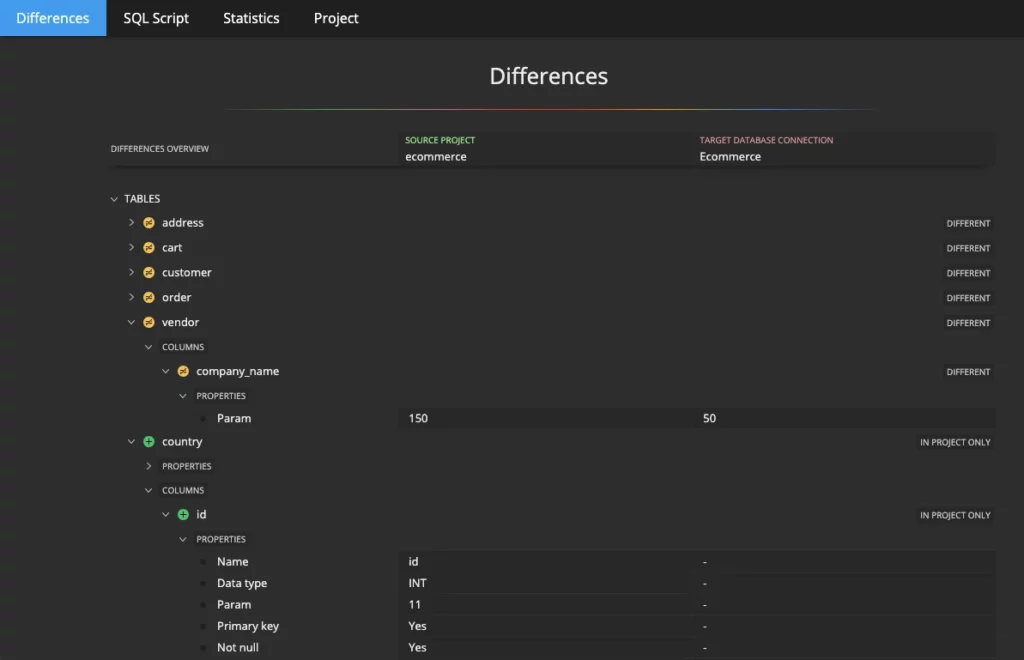
Comparing the current database structure with a modified version is crucial for understanding changes and their implications. By using tools that support schema comparison, you can generate a detailed documentation or report highlighting the differences between the two versions. This report can include changes in entities, attributes, relationships, and other objects.
Documenting these changes ensures that all modifications are tracked and understood, helping maintain data integrity and consistency. Additionally, it provides a clear record of the evolution of the database, which is essential for auditing and future development.
Conclusion
ER diagrams are invaluable tools for documenting and designing databases. They provide a clear, visual representation of the database structure, promoting better understanding, communication, and design. By following best practices, you can create effective ER diagrams that serve as the foundation for a robust and well-documented database.
