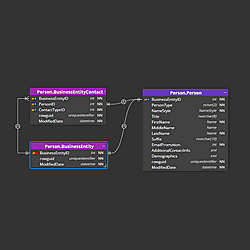
Dark and light themes for the MongoDB ER diagram
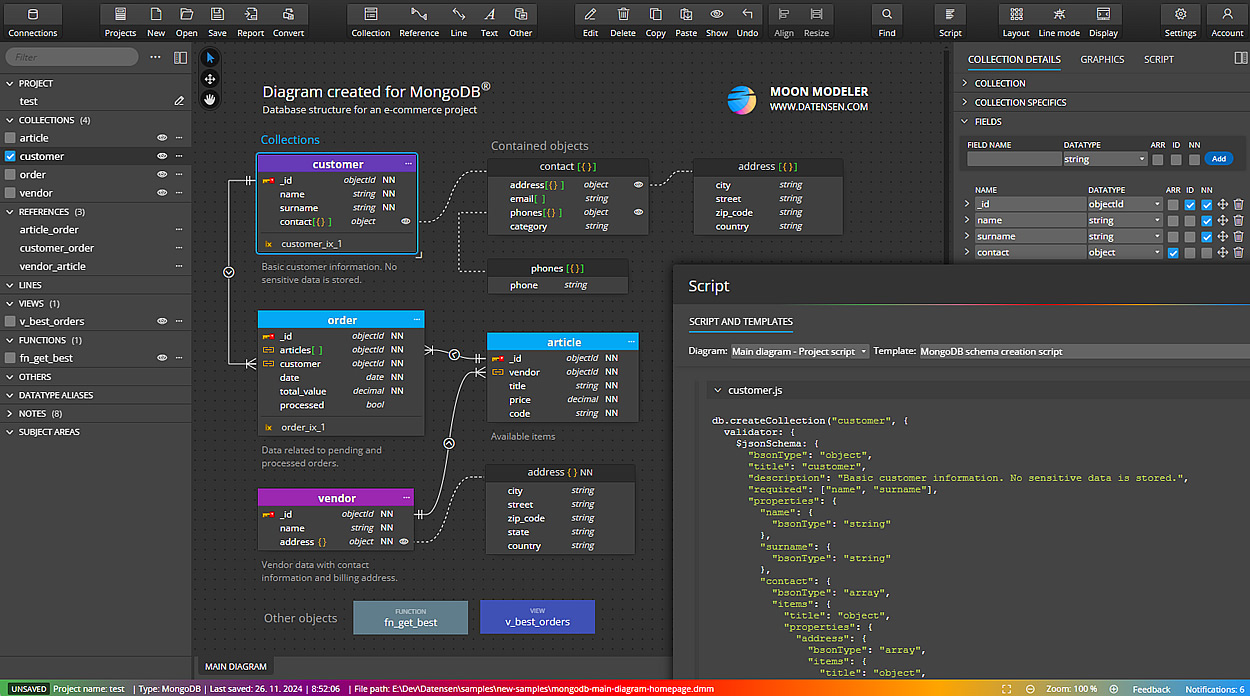
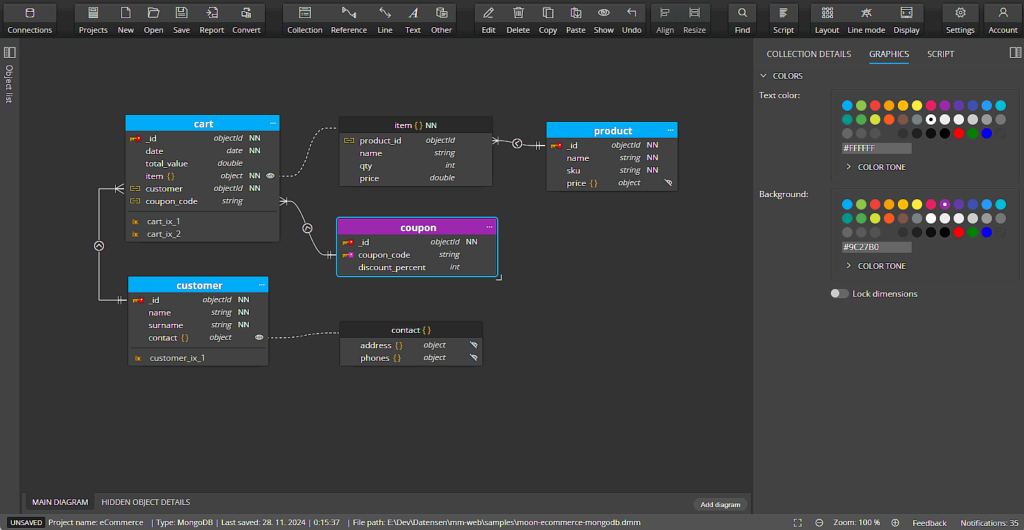
You can choose a dark or light theme in the application settings. The following screenshot shows the dark theme.
Levels of settings
MongoDB ER Diagram graphics can be adjusted on three levels in Moon Modeler.
- Global graphics can be specified at the project level
- Diagram graphics can be defined at the diagram level
- Graphical properties can also be modified at the selected object level
Graphics defined on the project level
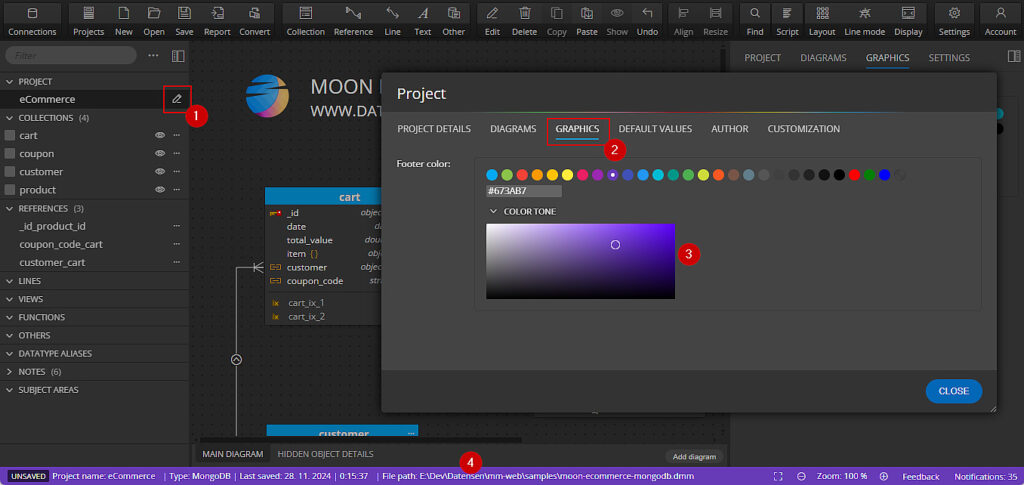
If you wish to change the footer color (e.g. for easier recognition of the project you currently work with), edit your project (1). Then change the color in section Graphics (2, 3). The footer will be displayed in the selected color (4).
Graphics defined on the diagram level
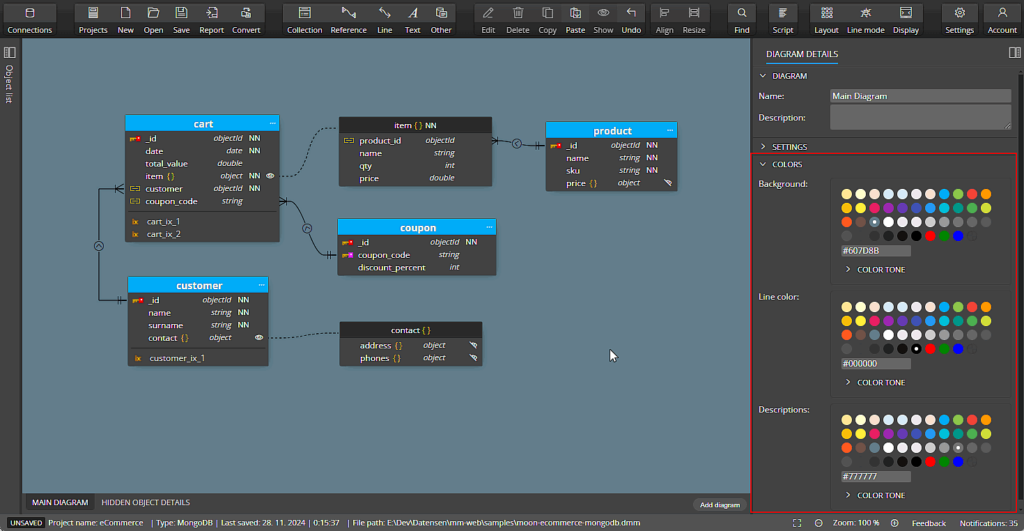
Click the diagram area to display diagram properties in the right side panel. Change background color, line color, and choose the line mode, display mode etc.
- Background color: specify a color for the diagram background. You can change the background color to any color or use transparent color. Transparent color is useful if you change the application theme from Light to Dark. If the Light theme is selected and the transparent color is activated, the background is set automatically to a slightly gray color. In case you enable the Dark theme, the background color is automatically set to dark gray color.
- Line color: can be specified for graphical representatives of references among collections or simple lines. Transparent color works similarly to how background color setting behaves.
- Line mode: allows you to switch from Basic line graphics rendering to Detailed and vice versa.
- Keys displayed graphically: choose if the id and referenced field should be displayed with red/yellow key or with textual marks.
Graphics specified for a selected object in MongoDB ER diagram
Colors for selected collection, contained object, note or other objects can also be specified in section Graphics. To change colors, select an object in your MongoDB ER diagram. Then specify values in the right-side panel. You can also double click any object to open a modal form. There you can specify the text and background colors comfortably as well.
# MongoDB ER diagram & graphics
