Read how to create a connection to your MongoDB Atlas cluster, connect to the MongoDB database, and visualize your data structure in form of an ER Diagram.
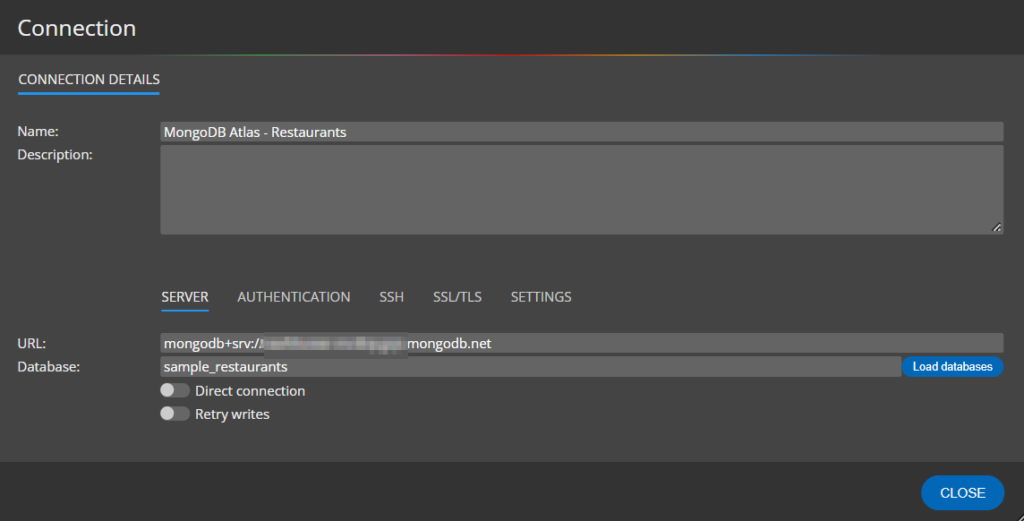
You can create a new connection to MongoDB databases easily. (The process is described step by step in our documentation.) A quick summary follows:
Step 1 – Navigate to section Connections. Create a new MongoDB connection by clicking the Create New Connection button. The New connection modal form opens. Specify Connection name and URL.

Define Authentication. In the Settings choose how you wish to load the schema. There are two options: load the schema from Data or from the Validator. If you pick Data as the preferred option, you will be able to set the data limit and select how to load references.
Step 2 – When your MongoDB Atlas connection is configured, click the Connect and reverse engineer existing database link at bottom. The schema of your existing MongoDB database will be loaded or inferred.

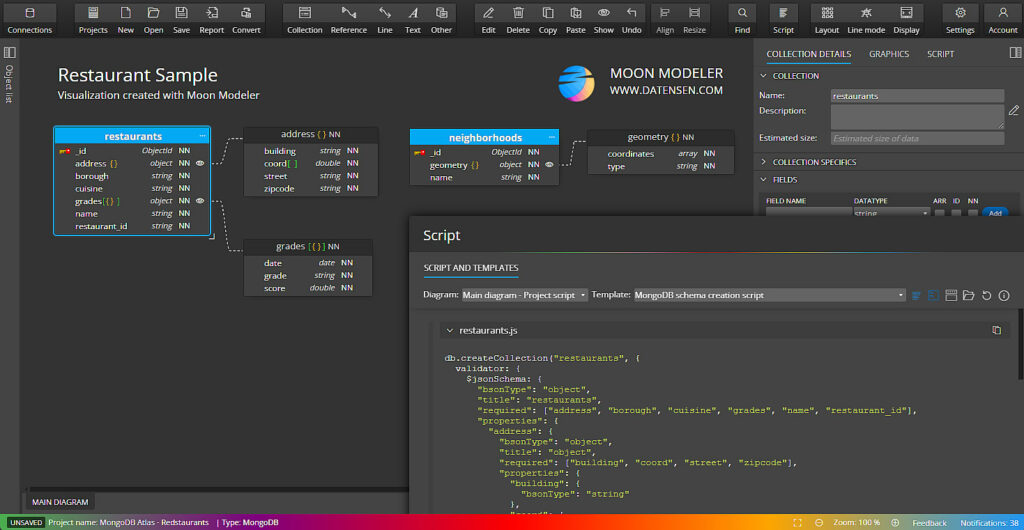
Step 3 – Review the generated ER diagram. It can look similar to this.

Feel free to re-arrange objects in your diagram, see recognized data types, set items as nullable and add notes and descriptions to your diagram. For each of the fields in MongoDB collections, you can also define specific properties, as well as sample data that can be displayed on the ER diagram.
How to generate the schema validation script?
As you can see on the screenshot above, script for your schema validation can be generated easily. All you need to do is to click the Script icon on the toolbar and review the generated MongoDB schema validation script.
Visualization of databases stored in MongoDB Atlas
You may wonder what the key benefit of such visualization is. Let’s see what we can find in MongoDB Atlas:
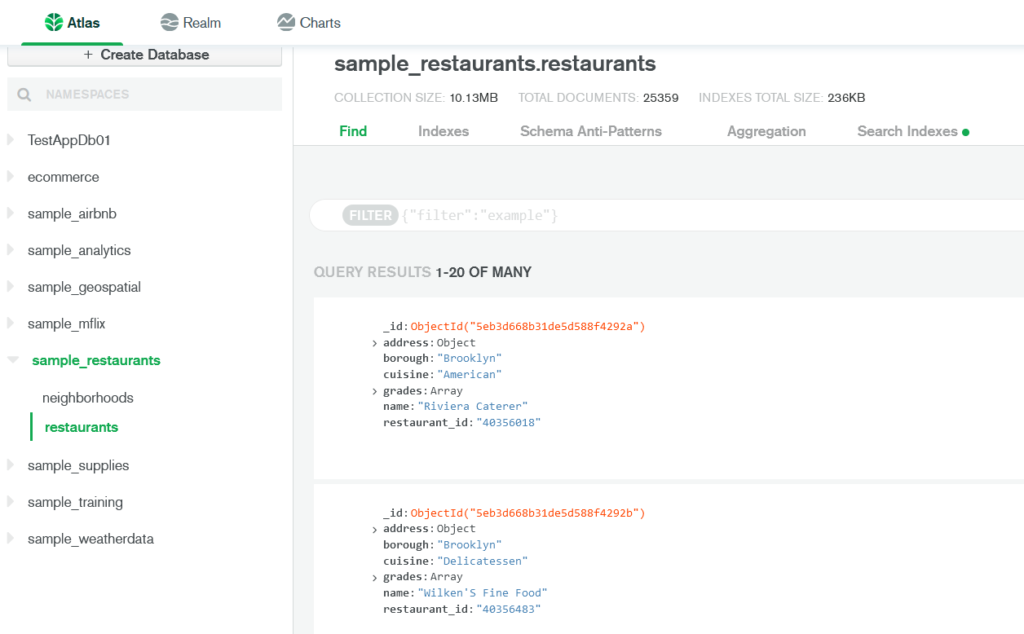
In the sample_restaurants database, in the details of the restaurants collection, we can see the actual data.
Note: The sample can be found at https://docs.atlas.mongodb.com/sample-data/sample-restaurants/#std-label-sample-restaurants

It is a nice overview of the data structure, however, it is not obvious which data type is used for storing data, whether some field is mandatory or not required at all etc.
For more complex structures, a diagram can serve much better for making documentation, for collaboration, and for team discussions. It is easy to change the positions of fields because, in Moon Modeler, this can be achieved by simple drag and drop operations. You can list more important fields above the less important ones add nested structures and much more. And of course: A picture/diagram is worth a thousand words.
Enjoy MongoDB data modeling in Moon Modeler and in case you have a suggestion or wish to provide feedback, contact us at any time. Thanks!
