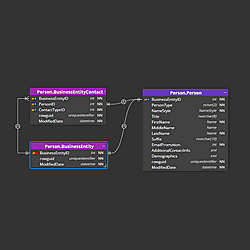
An overview of different types of graphical representatives that can be added to a diagram for MongoDB
- Collections
- Contained objects / embedded documents
- Other objects (functions, views, datatype aliases and other items)
Collections
Collections are basic elements of a database structure and determine where and how data will be stored. They are similar to tables in relational databases.
In Moon Modeler, collections are displayed by graphical boxes showing the name of the collection and fields that belong directly to the collection. According to the diagram settings, also data types, indexes, comments, etc.
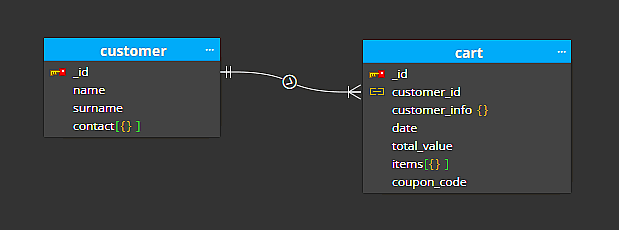
Collections exist separately, so you can manually add new collections to the diagram, create references between them, or add your own important information to them.
To edit a collection, select it in the diagram and enter properties in the right sidebar, or right-click the selected collection and select Edit from the context menu. A modal form opens where you can define properties and fields.
Contained objects / embedded documents
Document databases like MongoDB use a JSON-like format to store records. That means it allows you to store data using embedded documents. You are probably used to seeing these embedded documents displayed in collection boxes, as this is how they were often presented in MongoDB ER diagrams in various presentations more than 12 years ago.
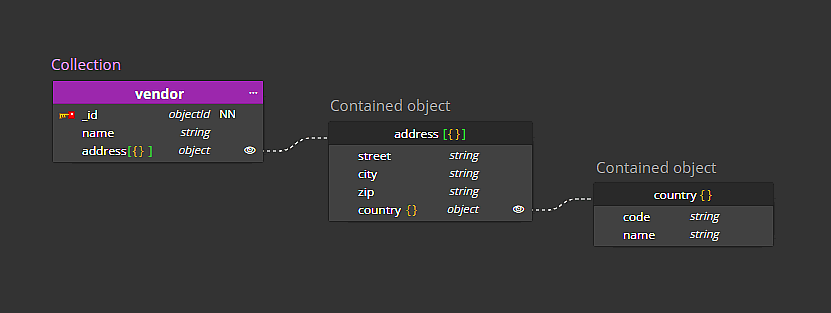
Moon Modeler works differently. Moon Modeler shows such structures using separate boxes and automatically draws containment lines pointing to contained objects.
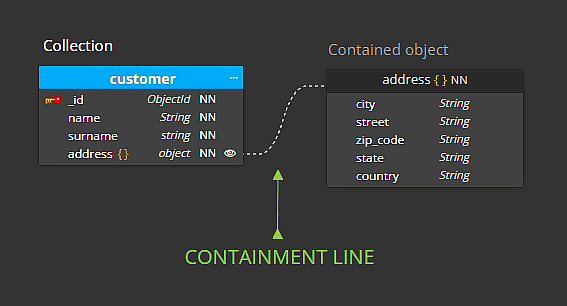
On the following screenshot you can see manually re-arranged contained objects and colored containment lines.
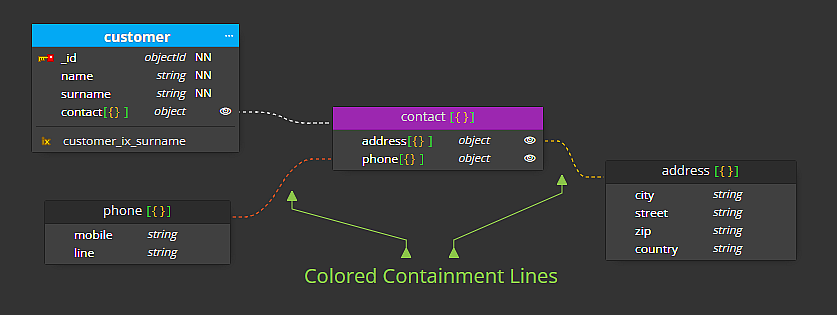
Editing contained objects is as easy as editing collections. To edit a contained object, select it in the diagram and enter properties in the right sidebar, or right-click the selected collection and select Edit from the context menu. This opens a modal form where you can define properties and fields.
Main benefits
Below you will find a short overview of the main benefits of showing embedded documents in separate boxes.
1. Focus on essential elements, less distractions
You can clearly work with the fields that belong to a given entity. You can see in the figure below that you can focus on working with vendor-related information, or you can focus on working with address-related information.
2. Greater clarity
Thanks to the possibility to color each of the boxes, you can achieve greater clarity. You can also add a text label and draw a line to the box that represents the contained object etc.
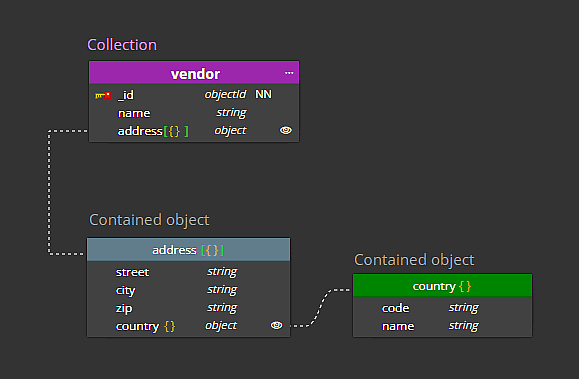
Note: For more complex hierarchical structures, displaying contained objects within the same collection would result in a long box containing the entire structure including all levels of embedded documents.
3. Possibility to hide objects
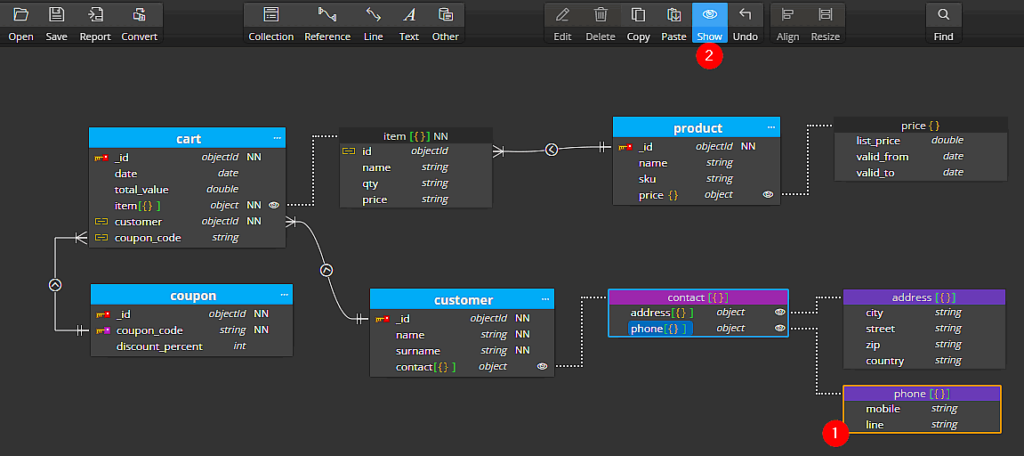
To keep focus on relevant parts of your design, you can also hide any individual contained object easily. To hide a contained object, select it on the diagram and click the Show/Hide icon on the main toolbar.
4. Productivity improvements
In addition to benefits related to visualization, Moon Modeler offers features that improve productivity. For example:
- When you select Object data type for a field, Moon Modeler creates a new contained object, adds a separate box to the diagram and draws a line pointing to the contained object. You can start adding fields to the created object immediately.
- Because contained objects cannot exist independently, Moon Modeler deletes them together with the container (a field, an object or a collection).
Other objects
Views, Functions, Datatype aliases and Other objects can also be added to your diagrams.

#
